

How Policing Styles Affect Crime Data: A Clear Guide

Policing style is defined as the operational philosophy a department uses to deploy officers, prioritize enforcement, and engage with the public. How policing styles affect crime data is not a minor methodological footnote. It is the central variable that determines whether official crime statistics reflect reality or a department’s performance goals. Victim reporting rates, internal classification practices, and organizational culture each bend the numbers in measurable ways. Researchers, students, and community advocates who treat published crime figures as objective counts are working from a flawed premise. The gap between actual crime and recorded crime is wide, and policing decisions drive much of that gap.
How policing styles affect crime data through victim reporting
The most direct channel between policing style and crime statistics is victim behavior. When residents distrust police, they do not report crimes. When they do not report crimes, those offenses never enter the official record.
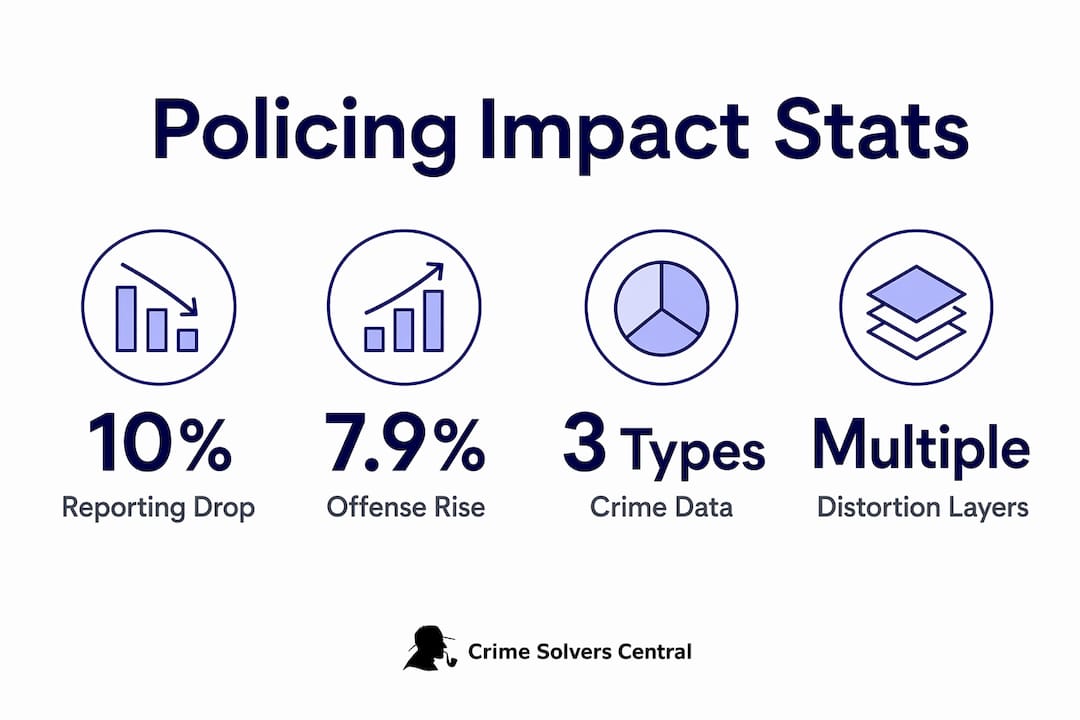
Research shows that a 10% decline in victim reporting leads to a 7.9% increase in actual offenses. That figure captures a feedback loop: fewer reports reduce deterrence, which produces more crime, which produces even fewer reports from communities that feel abandoned.
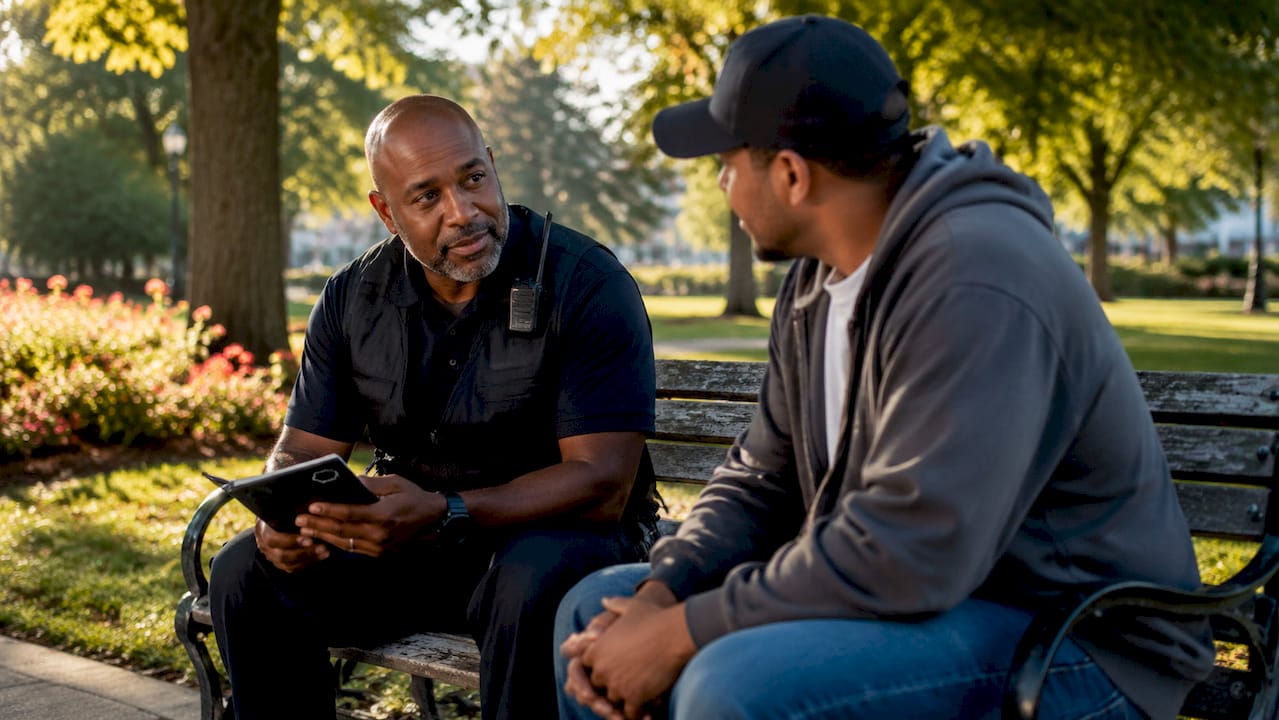
The concept that captures this gap is the “dark figure of crime.” It refers to all offenses that occur but never reach official records. Aggressive or militarized policing styles widen this figure significantly. Communities subjected to stop-and-frisk tactics or high-arrest-volume enforcement learn that contact with police carries personal risk. Victims in those neighborhoods weigh that risk before calling 911.
Community policing, by contrast, builds the trust that narrows the dark figure. Departments that assign consistent officers to neighborhoods, hold public meetings, and respond to non-emergency concerns see higher reporting rates over time. The policing approach and crime statistics it generates are inseparable.
Victim decisions not to report due to police-related reasons occur in 40–52% of the cases studied. That is not a marginal share. It means nearly half of non-reporting decisions trace directly to how victims expect police to respond, not to the severity of the crime itself.
Key factors that suppress victim reporting under certain policing styles include:
- Fear of retaliation from officers or community members after contact
- Anticipated dismissal of the complaint as too minor to investigate
- Language and cultural barriers in communities where officers lack local ties
- Immigration status concerns in areas where enforcement priorities overlap
- Prior negative contact with officers during aggressive enforcement campaigns
Pro Tip: When analyzing crime data for a specific jurisdiction, always check whether the department shifted policing styles during the study period. A drop in reported crime may reflect improved safety or a collapse in community trust.
How does internal police culture distort official crime statistics?
Victim behavior explains one layer of distortion. Internal police culture explains another. Official crime statistics often more accurately reflect police system dynamics than actual crime levels. That is a striking claim, and the evidence supports it.
The practice known as “cuffing” describes the systematic downgrading of serious crimes to lesser offenses. A robbery becomes a theft. An aggravated assault becomes a simple assault. Serious offenses reclassified as minor to meet targets is a documented, systematic practice in multiple departments. The effect is a statistical improvement that has no connection to public safety.
The Metropolitan Police Department in Washington, D.C. produced a documented case study. Single officers reclassified hundreds of crimes to meet department targets. That is not a rogue act. It is the predictable outcome of a performance management system that rewards lower crime numbers over accurate reporting.
Leadership style drives this behavior from the top down. Abrasive leadership causes officers to fudge stats under pressure to protect careers. Mid-level managers who face demotion for missing targets pass that pressure to frontline officers. The result is a chain of incentivized inaccuracy.
The sequence of distortion typically follows this pattern:
- Department leadership sets numerical crime reduction targets
- Targets become the primary metric for promotions and budget allocation
- Mid-level managers face career consequences for missing targets
- Officers reclassify or fail to record borderline incidents to protect their units
- Published statistics improve while actual crime conditions remain unchanged
- Policymakers allocate resources based on the distorted figures
“Numerical targets transform statistics from diagnostic tools into ends in themselves, undercutting true citizen security. Excessive focus on numerical crime reduction breeds a ‘dictatorship of the indicator’ that harms genuine public safety assessment.” The Dictatorship of the Indicator
The FBI’s transition from the Summary Reporting System to the National Incident-Based Reporting System (NIBRS) adds another layer of complexity. NIBRS records up to 10 crimes per incident, potentially inflating crime data relative to older systems. A department switching to NIBRS may show a statistical crime increase that reflects better counting, not worse conditions. Researchers who compare pre-NIBRS and post-NIBRS data without accounting for this difference will draw false conclusions.
What are the key nuances in interpreting crime rates across policing styles?
Crime data exists in three distinct forms, and conflating them produces bad analysis. Reported crime is what victims tell police. Recorded crime is what police formally enter into the system. Actual crime is everything that occurs, regardless of reporting or recording. The gap between these three figures varies directly with policing style and data collection methods.
Victimization surveys, such as the National Crime Victimization Survey (NCVS), measure reported crime independently of police records. They ask households directly about their experiences. Comparing NCVS data against FBI Uniform Crime Reports for the same period and jurisdiction reveals the size of the recording gap. When the two diverge sharply, the divergence points to either a reporting problem, a recording problem, or both.
The over-under policing paradox describes a specific failure mode in high-crime neighborhoods. Officers flood the area with enforcement activity, generating high arrest numbers, while victims of serious crimes receive slow or dismissive responses. The result is a data picture that looks active but misrepresents actual safety. Arrest counts rise while serious crime goes underreported.
Pro Tip: Cross-reference NCVS data with local police records for the same jurisdiction and time period. A large gap between the two is a reliable signal that policing style is suppressing victim reporting or that internal classification practices are distorting the record.
The table below shows how three data sources differ in what they capture and where they fail:
| Data source | What it measures | Key limitation |
|---|---|---|
| FBI Uniform Crime Reports | Crimes recorded by police | Excludes unreported and misclassified crimes |
| National Crime Victimization Survey | Self-reported victim experiences | Excludes homicides and crimes without survivors |
| NIBRS | Detailed incident-level police data | Inflates counts relative to older systems during transition |
Counting rule changes compound the problem. When a jurisdiction changes how it counts domestic violence incidents, for example, the recorded rate can jump or fall without any change in actual behavior. Researchers who track trends across rule changes without noting the shift will misread the data entirely.
How can researchers and advocates use this knowledge practically?
Understanding the mechanics of how police tactics influence crime rates is only useful if it changes how you work with data. Researchers, students, and community advocates can apply several concrete practices to produce more reliable analysis.
Cross-referencing multiple data sources is the baseline requirement. No single source, whether the FBI’s UCR, NIBRS, or a local department’s annual report, tells the complete story. Pairing official records with victimization surveys and community-level interviews produces a more accurate picture. Crimesolverscentral maintains a national database of over 264,913 cases, which gives researchers a reference point for cross-checking official figures against documented case records.
Accounting for underreporting requires knowing which communities are most likely to suppress it. Immigrant communities, LGBTQ+ individuals, and residents in heavily policed neighborhoods all show lower reporting rates under aggressive enforcement styles. Any analysis that treats their official crime figures as complete counts will underestimate actual crime. The policing paradox in overlooked communities is well documented and applies across multiple demographic groups.
Advocates pushing for policy reform should focus on transparency in data classification. Departments that publish their reclassification rates, audit their recording practices, and allow independent review produce more trustworthy statistics. Domestic violence cases illustrate this clearly. Law enforcement responses to domestic violence vary widely by jurisdiction, and those variations show up directly in recorded rates, not because the underlying behavior differs, but because recording practices do.
Additional practices that improve data reliability include:
- Requesting raw incident data rather than summary statistics from departments
- Tracking leadership changes that may signal a shift in performance culture
- Monitoring NIBRS adoption dates to adjust for counting rule differences
- Consulting community organizations that document unreported incidents directly
- Reviewing audit reports from inspector general offices that investigate data integrity
Understanding why crime database analysis matters is the foundation for any serious work in this field. Data that looks authoritative can be deeply compromised by the policing decisions that produced it.
Key Takeaways
Policing style shapes crime data at every stage, from whether victims report, to how officers classify incidents, to what leadership pressures drive the final numbers.
| Point | Details |
|---|---|
| Victim reporting drives data accuracy | A 10% drop in reporting produces a 7.9% rise in actual offenses, widening the dark figure. |
| Internal culture distorts classification | “Cuffing” and leadership pressure cause officers to downgrade serious crimes to meet targets. |
| NIBRS changes how trends read | Switching to NIBRS can inflate crime counts without any real change in public safety conditions. |
| Cross-referencing reduces error | Pairing NCVS data with official records reveals gaps caused by reporting or recording failures. |
| Over-under policing skews local data | Aggressive enforcement in high-crime areas raises arrest counts while serious crimes go unrecorded. |
The uncomfortable truth about crime numbers
Working with crime data long enough teaches one lesson that no methodology textbook states plainly: the number on the page is a political artifact as much as a factual one. Departments under pressure to show results will find ways to show results. That is not cynicism. It is the documented outcome of performance management systems applied to public safety.
What I find most troubling is how rarely this gets acknowledged in policy debates. A city announces a 15% drop in violent crime, and the press release goes out, the mayor takes credit, and the budget gets reallocated. Nobody asks whether the department switched classification codes, changed leadership, or adopted NIBRS that year. The number travels without its context.
The communities that pay the price for this are predictable. Residents in high-crime neighborhoods who already distrust police see their experiences erased from the official record. Their crimes go unrecorded, their neighborhoods get labeled as improving, and resources shift elsewhere. The dark figure of crime is not an abstract statistical concept. It represents real people whose victimization was invisible to the system designed to protect them.
Researchers and advocates who understand the mechanics of data distortion hold real power. They can challenge false narratives, demand transparency, and build the evidentiary case for reform. That work starts with refusing to take any single data source at face value.
— Crime
Crimesolverscentral and the case for transparent crime data
Researchers and community members who want to work with crime data that has not been filtered through departmental performance pressures need access to independent records. Crimesolverscentral provides exactly that. Its national cold case database covers over 264,913 missing persons and unsolved homicide cases, organized by state, giving researchers a concrete reference point outside the official reporting chain. When official statistics show a jurisdiction as low-crime but community members report otherwise, cross-checking against documented case records reveals the gap. Crimesolverscentral also supports community engagement through membership and advocacy initiatives, connecting the people most affected by data distortion with the tools to push back against it.
FAQ
How do policing styles affect crime data directly?
Policing styles shape crime data by influencing whether victims report crimes and how officers classify incidents. Aggressive enforcement reduces reporting, while internal performance pressures lead to systematic reclassification of serious crimes as minor offenses.
What is the dark figure of crime?
The dark figure of crime refers to all offenses that occur but never appear in official records. It grows when policing styles reduce community trust and suppress victim reporting.
Does community policing improve crime data accuracy?
Community policing increases victim reporting rates by building trust between residents and officers. Higher reporting rates produce more complete and accurate crime statistics.
What is “cuffing” in police data practices?
“Cuffing” is the practice of downgrading serious crimes to lesser offenses to meet department performance targets. It is a documented form of data manipulation that makes official statistics appear better than actual conditions.
How does NIBRS affect crime trend analysis?
NIBRS records up to 10 crimes per incident, compared to the single-crime counting of the older Summary Reporting System. Departments that switch to NIBRS often show statistical crime increases that reflect better counting, not worsening conditions.